

The distance between potential and opportunity is measurable.
And closable.
Convene maps the invisible walls between underserved students and college doors — tracking scholarship deserts, admissions gatekeeping, and funding cliffs across every zip code.
The gap isn't a gap.
It's a wall.
Access to higher education in America is not distributed by merit or ambition. It's distributed by geography, income, and institutional proximity. We mapped it.
Living in zip codes with fewer than 1 scholarship opportunity per 500 eligible students
Have zero college access professionals — counselors, advisors, or TRIO program staff
Left on the table in the last award cycle due to incomplete or unfiled FAFSA applications
Enroll in colleges below their academic qualifications, costing them in earnings and completion
Access Gap by Region — 2024
Interactive MapSource: Convene Access Index 2024. Based on IPEDS data, NCES school-level records, and proprietary zip-code scholarship availability scoring across 43,000+ zip codes.
“In 2024, a student's zip code is still more predictive of college enrollment than their GPA.”— Dr. Camille Okafor, Convene Senior Fellow, Education Geography
The 500 highest-performing low-income students in each state — nearly none attend a selective institution.
This is not a pipeline problem. It is a routing problem. The talent is there. The information, guidance, and financial scaffolding is not.
Serious people doing
hopeful work.
Our researchers have testified before state legislatures, briefed foundation boards, and published in peer-reviewed journals — but they started at kitchen tables too.

Dr. Camille Okafor
Senior Fellow, Education Geography
Scholarship desert mapping and zip-code-level access scoring
“Every data point is a student who didn't get the call they deserved.”

Marcus Reinholt
Director of Policy Analysis
State funding formula equity and legislative impact modeling
“Policy change without data is just advocacy. We bring the receipts.”

Dr. Priya Subramaniam
Lead Researcher, Admissions Equity
Holistic review audits and legacy admissions policy analysis
“Meritocracy is a story we tell. I prefer to measure what's actually happening.”
43,000+ zip codes scored on 14 access variables updated quarterly
280,000 students tracked across 6 years from 8th grade through enrollment
All major findings reviewed by external academic board before publication
47 school districts provide anonymized enrollment and outcome data under IRB protocol
Change is structural,
not accidental.
Three case studies. Three interventions. All driven by data precise enough to withstand a legislative hearing, a board presentation, and a budget fight.
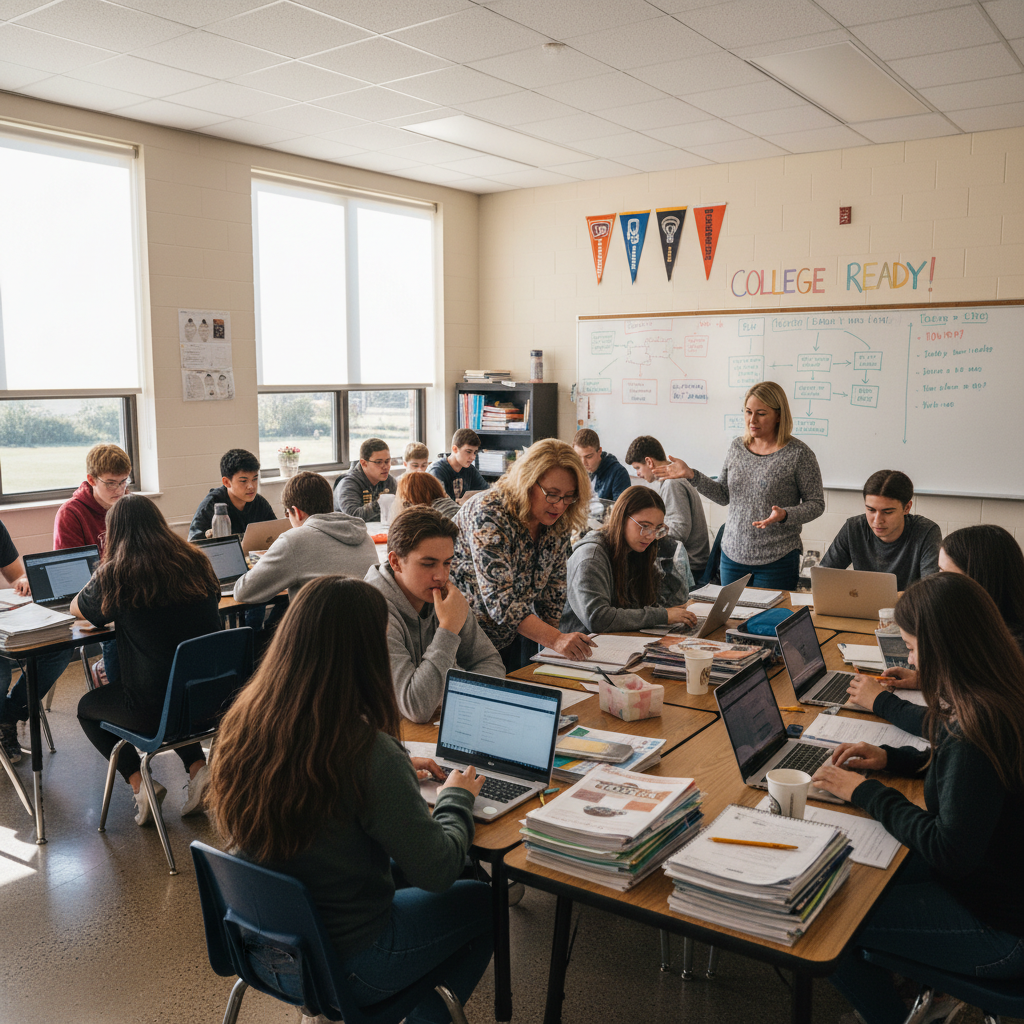
From 14% to 31% college enrollment in three years
Tulsa USD served 39,000 students — 72% qualifying for free/reduced lunch — with a single college advisor for every 680 students. Convene mapped the district's scholarship desert: 94% of students had no access to scholarship guidance within a 20-mile radius.
Convene's Access Gap Report, presented to the district's equity committee in March 2021, provided zip-code-level data showing where students were applying below their qualifications. The district used this to restructure advisor caseloads, target outreach to high-gap zip codes, and partner with three regional foundations identified through Convene's funding network.
The question isn't whether the data supports intervention. The question is whether the people with power to intervene have ever seen it laid out this clearly.— Marcus Reinholt, Director of Policy Analysis, Convene
Pull up a chair.
The work starts here.
Two days. 400 practitioners, policymakers, funders, and researchers. One shared table. Washington D.C. — October 14–15, 2025.


Reserve Your Seat at the Table
Registration is open to equity officers, program directors, legislators and their staff, researchers, and student advocates. Space is limited to 400 attendees.
Summit Details
2024 Access Gap Report
84 pages. Every zip code. Data that holds up under cross-examination.
“Papers spread out. Coffee getting cold. Someone just said something that changed everyone's mind.”
That's the room we're building.